Introduction
This page presents the implementation and experiment details of our work on Encrypted Network Traffic Classification using Deep Learning carried out at the School of Information Technology, Tan Tao University under the Grant No. TTU.RS.19.102.023. In this work, we develop a method for processing network traffic and generating graphs with node features and edge weights that better represent the communication behavior of mobile apps. A Deep Graph Convolution Neural Network (DGCNN) model has been designed to learn the communication behavior of mobile apps from a large number of graphs, thus being able to classify mobile apps. We also provide the description of the adoption of existing methods used for performance comparison (i.e., FlowPrint and AppScanner).
Data
We collect mobile traffic for 101 mobile apps. For each app, more than 30 hours of traffic is collected.
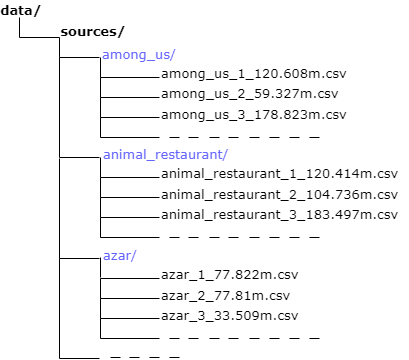
The mobile traffic is saved in a folder named source as csv files. The size of this folder is around 58.5GB, therefore we cannot provide the entire dataset via GitHub. It will be shared to specific email via Google Drive if requested (only for academic research purposes). Nevertheless, a portion of dataset is available in this repository for the purpose of verification and testing. Inside this folder, there are 101 sub-folder. Each sub-folder contains the data of one app. Duration of mobile traffic catures in different files is different (min: 4.664 minutes, max: 465.7 minutes, mean: 101.573 minutes). The structure of source folder is shown as below.
Guide
1. Generate mobile traffic chunks with the same length
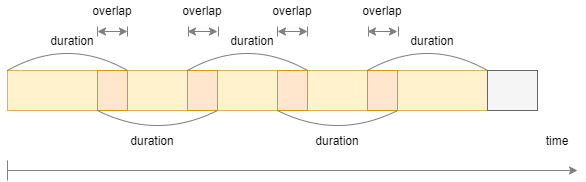
As the image above, a big mobile traffic chunk (saved as a CSV file) is splitted into many small chunks with the same length. There are two hyper-paramters here:
- Duration (Twindow): Length of each traffic chunk after generating.
- Overlapping window: Use to increase the frequency of sample collection and classification. If the duration Twindow is short enough, we do not need to have overlapping.
There are 5 set of hyper-parameters (Duration – Twindow and Overlapping window):
| Hyper-parameters | set1 | set2 | set3 | set4 | set5 |
|---|---|---|---|---|---|
| Duration - Twindow (minutes) | 5 | 4 | 3 | 2 | 1 |
| Overlapping window (minutes) | 3 | 2 | 1 | 0 | 0 |
Running notebook “generating_samples.ipynb” to create the mobile traffic chunks with the same length. We need to provide input as a set of hyper-parameters (duration Twindow, overlapping window) at the beginning of the notebook. After running the notebook with 5 sets of hyper-parameters, the result will be saved as shown in the image below:

For each set of hyper-paramters, there is a folder named samples that contains the mobile traffic chunks.
2. Train-test split
Running notebook “generating_train_test.ipynb” to split the data into training and testing data. In our experiment, the split ratio is 80:20 for training set and test set, respectively. After running the notebook, the information of training and testing samples is saved in a json file “train_test_info.json”
The structure of a json file: { app1: (list of filenames of training samples, list of filenames of testing samples), app2: …… }
Because there are 5 sets of parameters, we will have 5 files ‘train_test_info.json’. They are saved as shown in the image below.

3. Generating graphs from traffic chunks
Running notebook “generating_graphs.ipynb” to convert all traffic chunks into graphs and save all of the graphs in 2 folders train_graphs and test_graphs (training and testing samples are determined by ‘train_test_info.json’).
There are two more hyper-parameters we need to input in the notebook before generating graphs. (N and tslice). Each set of hyper-parameters (N, tslice) will also produce different set of graphs. N is the number of graph nodes that will be used to train the DGCNN model.
The combination of all parameters we use to run experiments:
| Duration-Twindow (minutes) | N | tslice (seconds) |
|---|---|---|
| 5 | 7 | 10 |
| 10 | ||
| 20 | ||
| 30 | ||
| 10000 | ||
| 20 | 5 | |
| 1 | ||
| 4 | 20 | 10 |
| 3 | ||
| 2 | ||
| 1 |
The graphs are saved in the structure as below:

All graphs of one app with a specific set of parameters are saved in 2 CSV files (features.csv and weights.csv). In both files, there is a column named graph_id to distinguish between different graphs.
4. Running experiments
Given graphs generated with different parameters (N and tslice). Next step is running notebook “train_GNN.ipynb” to train the DGCNN model and do prediction on the testing dataset.
There are 6 hyper-parameters we need to choose before running the notebook. Each set of hyper-parameters will correspond to one experiment.
List of hyper-parameters:
- N: The maximum nodes kept to build a graph as mentioned above.
- tslice: Slide duration, used to compute weight between 2 nodes.
- k: A hyper-parameter defined in DGCNN architecture, which defines the number of graph nodes whose features are used to construct the feature vector before the fully-connected layers. Without stating explicitly, we set k=N.
- Twindow: Duration of mobile traffic used to generate a graph.
- apps: List of apps we want to classify.
- features: List of features of each node used to classify.
All experiments with MAppGraph presented in the paper:
1. Impact of Number of Graph Nodes used to Train Models (Figure 8)
| N | tslice (seconds) | k | Twindow (minutes) | apps | features |
|---|---|---|---|---|---|
| 7 | 10 | 7 | 5 | List of 101 apps | List of all 63 features |
| 10 | 10 | ||||
| 20 | 20 | ||||
| 30 | 30 |
2. Impact of Time Window Duration of Traffic Collection for Graph Construction (Table 4)
| N | tslice (seconds) | k | Twindow (minutes) | apps | features |
|---|---|---|---|---|---|
| 20 | 10 | 10 | 5 | List of 101 apps | List of all 63 features |
| 4 | |||||
| 3 | |||||
| 2 | |||||
| 1 |
3. Impact of Slice Duration on Cross-Correlation in Graph Construction (Table 5)
| N | tslice (seconds) | k | Twindow (minutes) | apps | features |
|---|---|---|---|---|---|
| 20 | 1 | 10 | 5 | List of 101 apps | List of all 63 features |
| 5 | |||||
| 10 |
4. Performance with and without using the IP Addresses in Feature Vectors (Figure 9)
| N | tslice (seconds) | k | Twindow (minutes) | apps | features |
|---|---|---|---|---|---|
| 20 | 10 | 10 | 5 | List of 101 apps | List of all 63 features |
| List of 59 features (without IP features) |
5. Classification of Mobile Apps with Similar Functionalities (Figure 10)
| N | tslice (seconds) | k | Twindow (minutes) | apps | features |
|---|---|---|---|---|---|
| 20 | 10 | 10 | 5 | List of 17 similar apps | List of all 63 features |
| List of 17 different apps |
- List of 17 similar apps: ‘diijam’, ‘myradio’, ‘spotify’, ‘nhaccuatui’, ‘soundcloud’, ‘sachnoiapp’, ‘truyenaudiosachnoiviet’, ‘voizfm’, ‘tunefm’, ‘radiofm’, ‘nhacvang’, ‘wesing’, ‘kaka’, ‘podcast_player’, ‘starmarker’, ‘zingmp3’, ‘truyenaudio’
- List of 17 different apps: ‘zingmp3’, ‘fptplay’, ‘baomoi’, ‘nimotv’, ‘messenger’, ‘tiki’, ‘facebook’, ‘lienquan_mobile’, ‘quora’, ‘among_us’, ‘azar’, ‘tiktok’, ‘medoctruyen’, ‘weeboo’, ‘tinder’, ‘hago’, ‘bida’
6. Performance with Different Number of Apps (Figure 11)
| N | tslice (seconds) | k | Twindow (minutes) | apps | features |
|---|---|---|---|---|---|
| 20 | 10 | 10 | 5 | List of 10 apps | List of all 63 features |
| List of 20 apps | |||||
| List of 30 apps | |||||
| List of 40 apps | |||||
| List of 50 apps | |||||
| List of 60 apps | |||||
| List of 70 apps | |||||
| List of 80 apps | |||||
| List of 90 apps | |||||
| List of 101 apps |
- The list of 10, 20, 30, 40, 50, 60, 70, 80, 90, 101 apps can be found in apps_list.txt.
- The list of apps is chosen randomly from 101 apps.
Artifact Verification
- Due to limitation of storage space offered by GitHub, we only provide the processed datasets of two cases presented in Table 4 of the paper corresponding to Twindow = 5 minutes and Twindow = 2 minutes. The other hyper-parameters are N = 20, k = 10, tslice = 10s. The number of classification app is 101. You can run the notebook “train_GNN.ipynb” (using Google Colab - around 5h per 150 epochs or GPU computer - depending on configuration) with the default configution of the hyper-parameters (Twindow=5, N=20, k=20, tslice=10s) on DATA T5_3.
- For the second case (i.e., Twindow=2, N=20, k=20, tslice=10s), please change the parameter Twindow = 2 as well as Overlap = 0 in Config Seting section to work with DATA T2_0.
- To run other experiments, you need to follow all steps in the guide section to generate data again and run the notebook “train_GNN.ipynb” with different config setting. Data is available if requested only for research purposes.
Raw Data
- The PCAP files will also be provided if requested only for research purposes.
Publications
- Thai-Dien Pham, Thien-Lac Ho, Tram Truong-Huu, Tien-Dung Cao, Hong-Linh Truong, “MAppGraph: Mobile-App Classification on Encrypted Network Traffic using Deep Graph Convolution Neural Networks”, Annual Computer Security Applications Conference - ACSAC’2021.
Support or Contact
For any query or issue, please contact dung.cao@ttu.edu.vn and truonghuu.tram@singaporetech.edu.sg